Electrical & Resistivity Imaging
Investigate the electrical characteristics within the subsurface to support environmental evaluations, delineate groundwater, and inform the design of infrastructure earthing systems.
Applications
- Landfill investigations
- Groundwater investigations including depth to the water table and aquifers
- Delimitation of the interface between fresh and saltwater
- Cartography and surveillance of soil salinity and plumes of inorganic contaminants
- Identification of paleochannels, faults, and zones with fractures
- Detection of voids, mineshafts, and cave systems
- Mapping of stratigraphy, encompassing gravel and clay formations
- Evaluation of soil corrosion
- Designing the grounding systems for infrastructure
Method
Electrical Resistivity Tomography (ERT), or Electrical Resistivity Imaging (ERI) in other words, demonstrates sensitivity to fluctuations in subsurface electrical resistivity, quantified in Ohm meters (Ωm). The primary influencers impacting the overall electrical resistivity (and its reciprocal: conductivity) of soil or rock include:
- Material porosity and permeability
- The degree and type (including salt content) of fluid saturation
- The presence of plays with moderate to high cation exchange capacity (CEC)
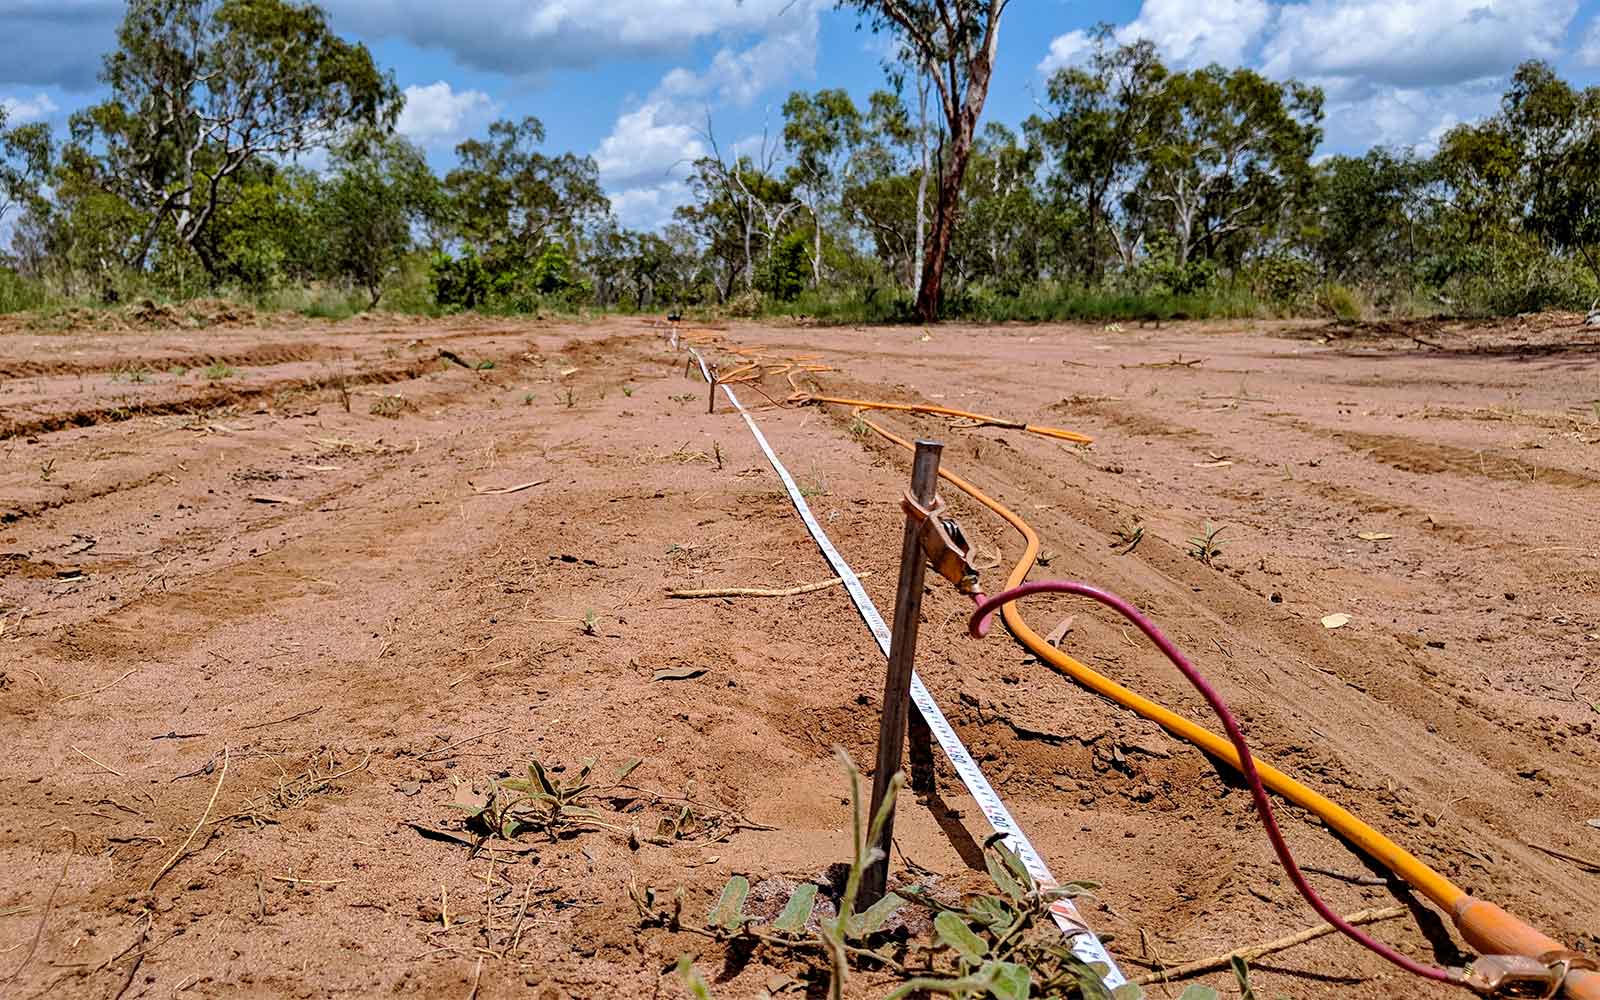
Conducting resistivity measurements involves introducing an electrical current into the ground through a pair of current electrodes and gauging the ensuing voltage disparity at two potential electrodes. With knowledge of current and voltage parameters, one can compute an apparent resistivity value, and the investigation depth is contingent on the electrode separation. Enhanced depths are attainable by widening the gap between electrodes. Various electrode configurations are available, each catering to specific conditions.
Contemporary resistivity systems utilize several electrodes linked to a central control unit through multiple core cables. After deploying the electrode array and configuring the sequence program in the control unit, automated readings are captured at various electrode positions.
Data Analysis & Presentation
Following the acquisition of a resistivity sequence, a pseudo-section is created to display the apparent resistivity measurements at different depths along the profile. Utilizing mathematical inversion algorithms, quantitative resistivity readings can be computed by processing the pseudo-section, yielding a 2D geo-electrical cross-section illustrating variations in the modeled electrical resistivity of the subsurface. Interpretation of the resistivity section offers insights into subsurface layering, as well as linear and isolated features.
The depth of imaging attainable through the ERI technique relies on the total length of the electrode array, wherein wider electrode spacings contribute to increased imaging depth. Additionally, the subsurface resistivity as a whole impacts the imaging depth, as highly resistive ground tends to reduce the depth following inversion.
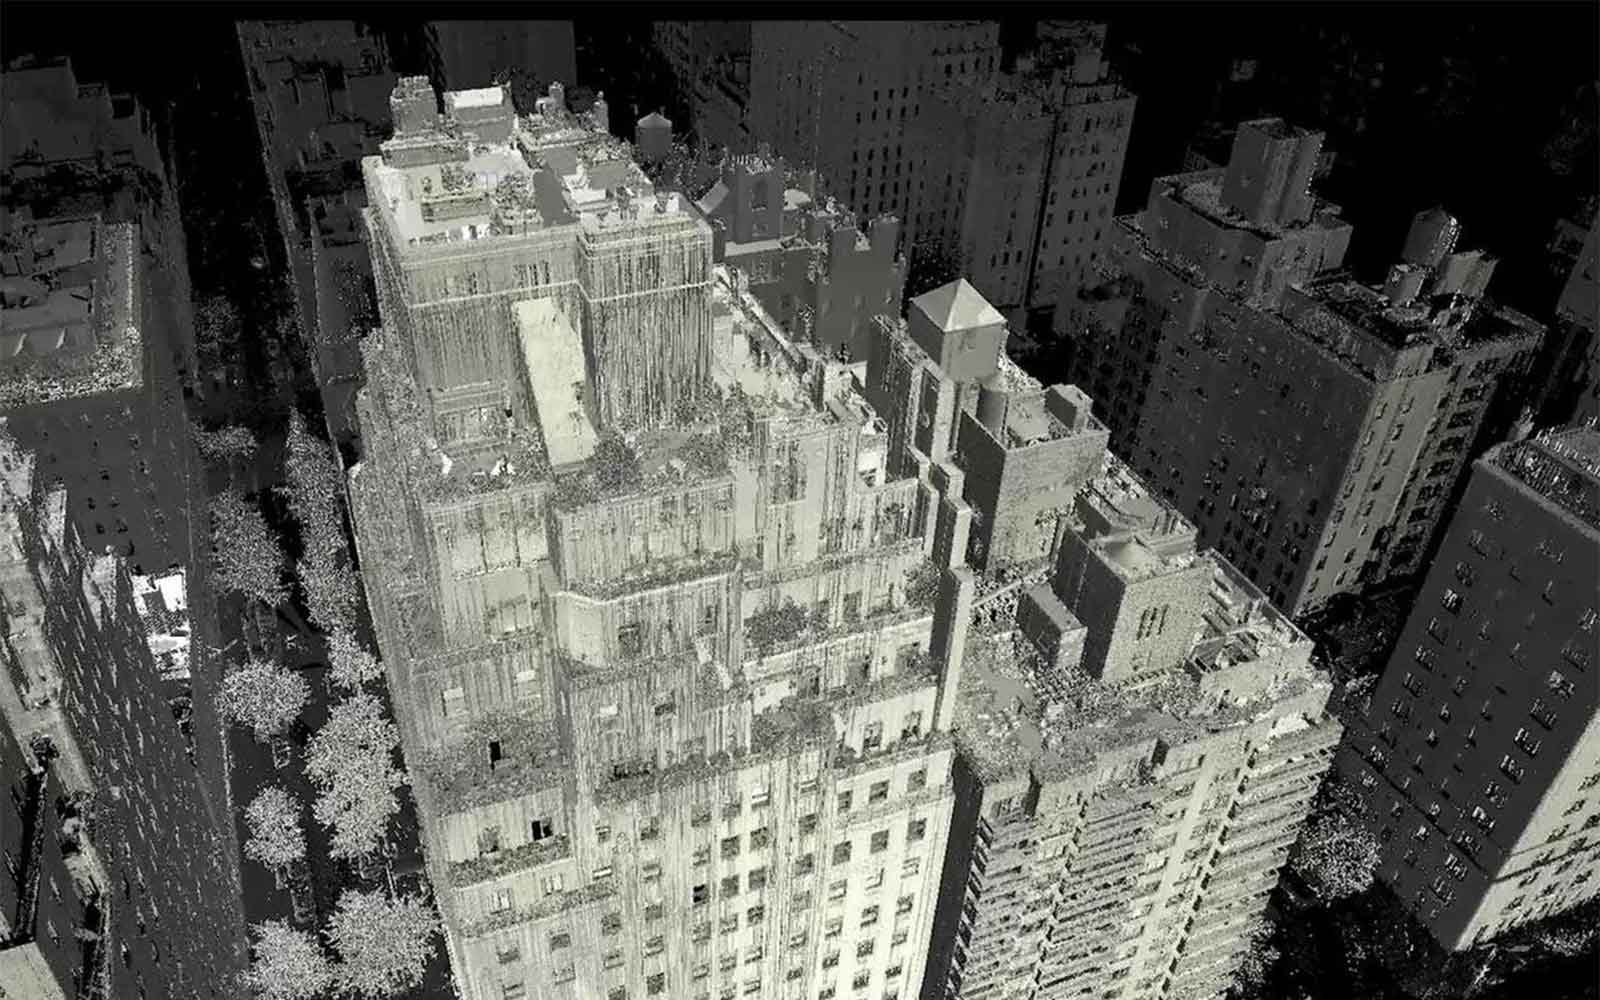
Featured Work
GBG explores an extensive array of structures, ranging from historically noteworthy edifices to modest private dwellings.


Enquire Now
Complete the form below, call us at +1 917 297 0913 (New York office), +1 805 393 2021 (Boulder CO office) or +1 310 745 9301 (Los Angeles office). A member of the team will respond ASAP to discuss your requirements.
Please note: GBG Group is compliant with the General Data Protection Regulation (GDPR). To learn more about how we collect, keep, and process your private information in compliance with GDPR, please view our privacy policy. *
Contact Us
